A-Level playing field? Educational equity in the UK
Issue 86 l Eka’s Weekly Roundup (22 August 2024)
This week, we're looking into the latest A-Level & GCSE through the lens of social and health equity. While overall grades have steady over the medium term, the story beneath the surface is far more nuanced.
We explore:
The persistent influence of socioeconomic factors on academic achievement.
The reasons behind disparities including 1-1 tutoring and social pressures.
The long-term impact of school results on future earnings and health.
We hope you enjoy the (summer) read ☀️
Uncovering the layers below A-Level achievement 🗞️
1. A-Level results have been stable over time
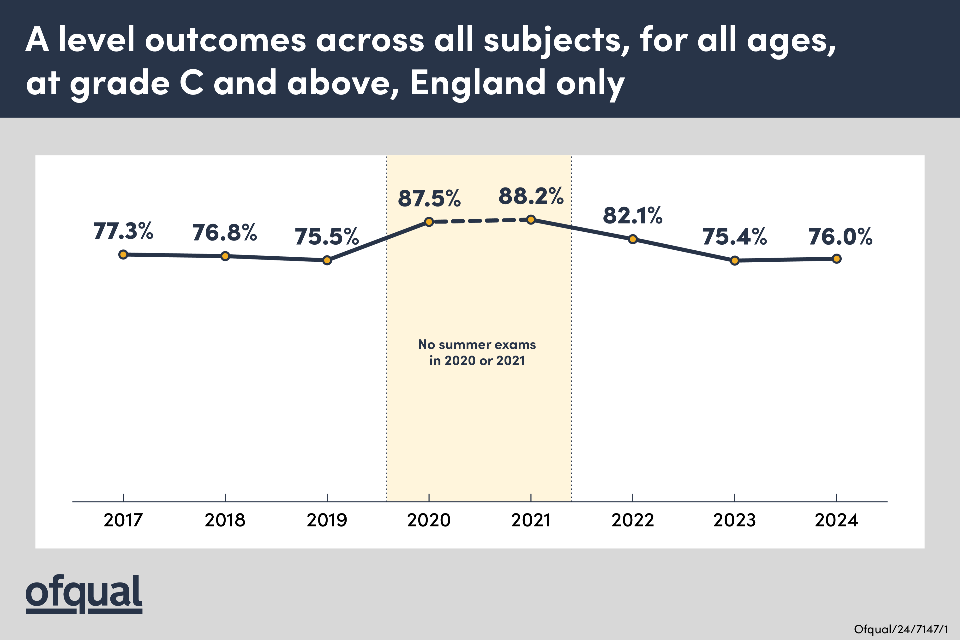
A-Level results have shown a general upward trend over the past decades, with some fluctuations. In 2024, A-Level grades above C stood at 76% which is broadly in line with pre-pandemic levels of 76-77%.
The top level grade, A*, has seen slight inflation in the 2024 numbers compared to 2019. In 2019, 7% of grades were an A*. Most recently, this has risen closer to 10%. On the whole though the distribution has been broadly stable bar for the Covid-19 period shown in both charts above and below.
2. The clear link between parental income and educational attainment…
Research consistently shows a correlation between parental income and A-Level attainment. A study by the Education Policy Institute found that students from disadvantaged backgrounds (as measured by free school meal eligibility) had less qualifications than their non-disadvantaged peers.
The disadvantage gap, or the difference in attainment depending on free school meal availability, has been around 3 grade points in recent years when comparing advantaged to disadvantaged A-Level students.
Ofqual also publishes Equities Analysis each year following the publication of A-Level results. The website is a bit clunky but here are two interesting cuts on the data (note this is data from the 2018-2023 cohorts rather than 2024).
A-Level relative attainment is relatively close between FSM and non FSM (free school meal) students.
This is a different conclusion than the previous charts shown from the Education Policy Institute. Qualification level: A-Levels. Variable: FSM (free school meals). Outcome measure: numeric grade, shown on a relative basis rather than absolute basis.
GCSE relative attainment shows higher dispersion between FSM and non FSM students.
Qualification level: GCSEs. Variable: FSM (free school meals). Outcome measure: numeric grade, shown on a relative basis rather than absolute basis.
… and A-Level results’ impact on future expected earnings
There isn’t perfect data on A-Level results’ impact on expected earnings, so instead we’re looking at university attendance according to family background and expected earnings.
The results are quite incredible (emphasis mine);
These findings suggest that FSM-eligible pupils who are able to attend the most selective universities may be able to overcome almost all of their disadvantage in earnings potential. FSM-eligible pupils who attend any university on average may be able to halve their disadvantage in earnings potential. However, the authors note the evidence is only ‘suggestive’ of this and they cannot rule out that the decline in the gap is due to other factors related to the type of disadvantaged person who attends university. For example, if disadvantaged pupils were relatively more motivated to earn more than their relatively wealthier peers, even if the university education did not provide any additional earnings potential, we might still observe a reduction in the gap.
There are, of course, confounding factors like 1) self-selecting motivation, 2) existing social networks, and 3) job selection (among many others).
The IFS plotted how different qualification levels impacted median annual earnings across a lifetime, showing that there was a large gap between degree level and A-level.
3. But why is the impact so large?
Often, the disparity is attributed to "access to better resources," but what exactly are these resources?
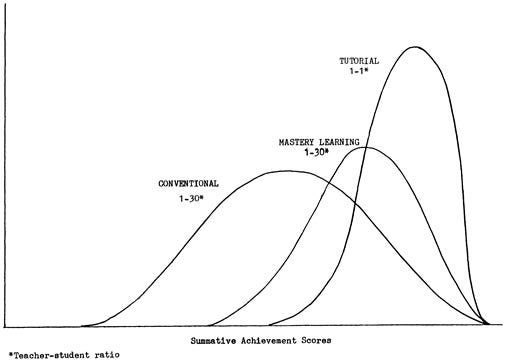
We think they extend beyond just physical tools and teaching aids—though these are certainly important, as demonstrated by concepts like Bloom's 2 sigma problem. Bloom found that 1-1 tutoring leads to a two standard deviations improvement than students in a classroom environment. This means that wealthier students who can afford tutoring achieve much better in schools early on.
They likely also include intangible factors such as time, focus, and social pressures. For instance, students from lower socioeconomic backgrounds may face environments with less perceived pressure to excel academically.
4. One level up: education explains 20-30% of all health inequities.
Educational attainment, including A-Level results, is intrinsically linked to broader social determinants of health. Higher educational achievement is associated with better health outcomes, longer life expectancy, and improved overall well-being.
The World Health Organisation estimates that about 25-30% of health inequities can be attributed to educational disparities. A large part of this correlation is linked to underlying economic differences. For example, people with higher levels of education are more likely to:
Have access to better job opportunities and higher incomes
Live in safer neighbourhoods with better access to health services
Make healthier lifestyle choices
A-Level results serve as more than just academic markers. They reflect broader socioeconomic inequalities and can have lasting impacts on individuals' life trajectories. Addressing these disparities is crucial for creating a more equitable society and improving overall public health outcomes.
Week in Impact Articles ✍🏽
Monday: GPs use AI to boost cancer detection rates in England by 8%
Thursday: Epic moves forward on health app interoperability
Friday: Why Does Ozempic Cure All Diseases?
3 Key Charts 📊
1. Energy is wealth. Plotting electricity & income across the world shows a simple relationship.

2. Plugging the leaks - fuel oil users benefit most from a net zero retrofit.

3. Startups are hitting the brakes in 2023-24.

Getting in Touch 👋.
If you’re looking for funding, you can get in touch here.
Don’t be shy, get in touch on LinkedIn or on our Website 🎉.
We are open to feedback: let us know what more you’d like to hear about 💪.


