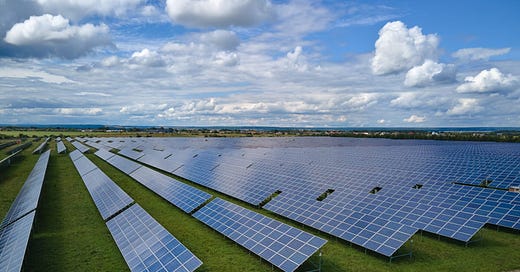
The last two decades have seen a surge in solar PV deployment.
Since the early 2000s, solar capacity has doubled approximately every three years. Today, solar energy is now 4% of the global energy generation mix and has reached 15-20% of generation in Luxembourg and The Netherlands.
The rise of solar power is reshaping electricity markets, influencing pricing mechanisms, and driving changes in energy policy. We will explore 1) the evolution of day ahead and reserves pricing in Europe, 2) the response from other energy sources like nuclear in a growing solar mix, and 3) the broader implications for the energy system.
As we finish writing this newsletter, (timely!) research has just come out highlighting the Solar Surge’s health impact on local communities who have had coal plants displaced. Researchers from Chile found that increasing solar generation capacity led to displaced coal generation and reduced hospital admissions due to respiratory diseases (particularly in those cities that are downwind of displaced coal plants).
A special thank you to all the articles which we read this week:
The exponential growth of solar power will change the world (The Economist)
Global market outlook for solar power 2023 - 2027 (SolarPower Europe)
The health benefits of solar power generation: Evidence from Chile (Rivera et al, 2024)
The changing energy landscape 🗞️
Solar has come a long way since the 2000s
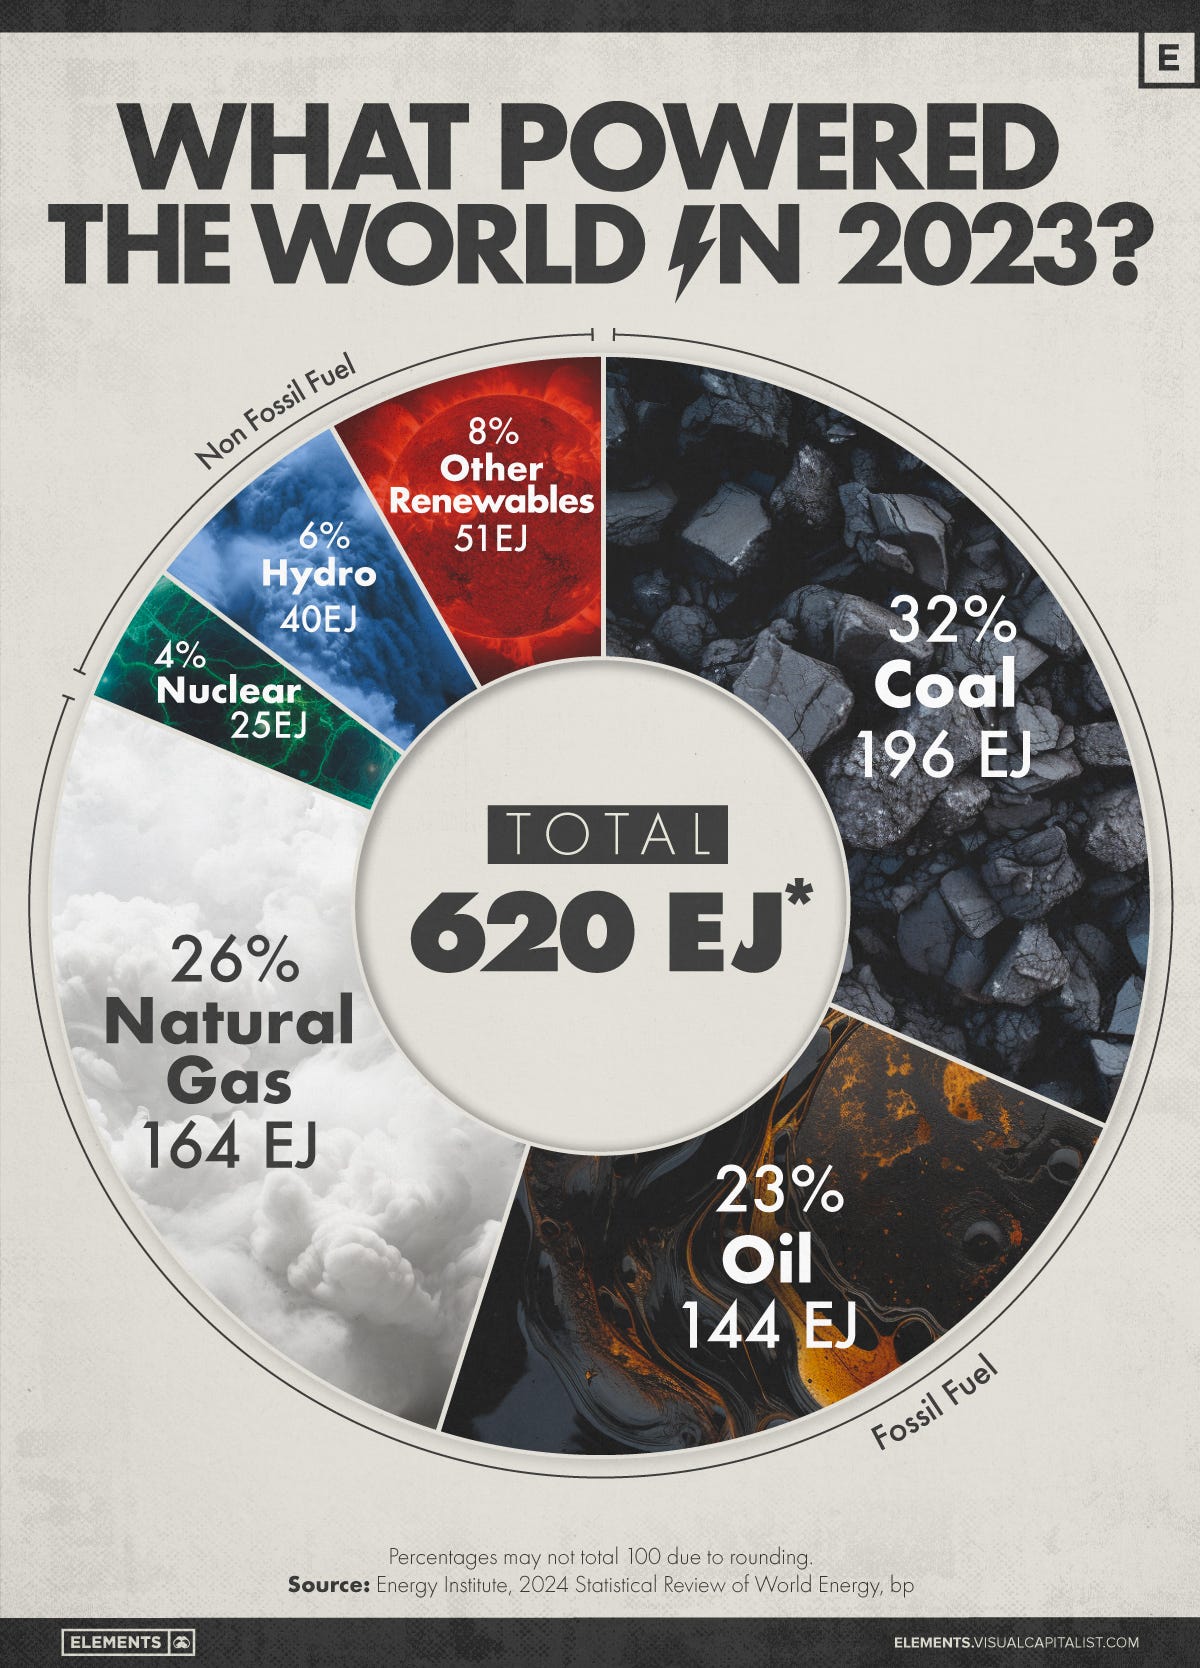
Solar capacity deployment has been exponential in the last 20 years. Installed capacity has almost doubled roughly every three years. Expectations have consistently been exceeded with solar now powering 4% of the global energy generation mix. For context, coal and oil are still 32% and 23% of production globally (see Charts section at the bottom).
Even so, the solar rise is reshaping the global energy landscape, with significant implications for electricity markets, pricing mechanisms, and energy policy. As solar power continues to proliferate, understanding its impact on market dynamics and grid stability becomes crucial.
Pricing dynamics will need to change: both on reserves and day-ahead rates
The more solar generation comes on the grid, the more the pricing dynamics will change given energy intermittency.
Solar power generation peaks during the day when sunlight is abundant, leading to a reduction in electricity prices due to its virtually zero marginal cost. However, this creates a paradox where the highest value of solar power does not align with its peak production times (Axle Energy has written about this here).
Market prices often hit their lowest when solar output is highest, particularly in the afternoon. This inverse relationship means that the financial value of solar power is maximized during morning and evening peaks, when demand is high, but solar production is lower.
European countries are already seeing oversupply at peak solar times (i.e. 3pm in July). For example, Belgium reached a record low price of -140 €/MWh (the record lowest energy price for 2024 so far).
So how do we smooth the curve? One suggestion which the GEM article suggests is to install solar panels with different orientations, such as vertical East-West positions. These installations may have a higher cost of energy as they are less efficient than a traditional position, but they could offer better market value given their impact on peak energy prices.
We are big believers in residential flexibility and have backed Axle which seeks to connect home energy assets with flexibility incentives (i.e. home batteries and solar PV) which will lower home energy costs and facilitate the renewables deployment.
Other energy sources like nuclear are having to adapt
As solar energy's share of the power mix increases, it displaces other energy sources. Traditional assets like gas plants, nuclear, and even offshore wind farms reduce their output during sunny periods, especially in the afternoon when solar power is at its peak.
One example is France’s nuclear generation output summer months, which dips during the peak solar times (thanks again to the GEM newsletter).
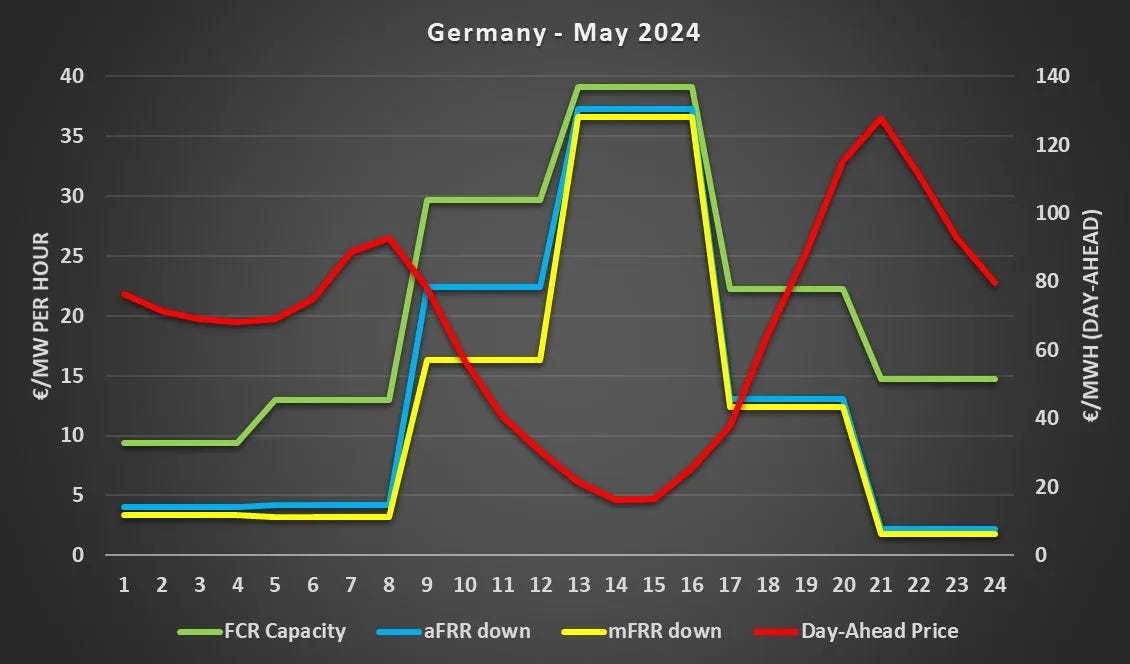
This shift can also be observed in countries like Germany, where solar energy leads to significant changes in import-export dynamics and reduces the utilization of other power assets. As solar displaces other energy sources, we are seeing a an increase in the price of power reserves (opposite direction than price on day-ahead market).
The chart below has a lot of acronyms, so for clarity:
FCR: Frequency containment reserves. As energy supply and demand must be balanced, grid operators power reserves to regulate the equilibrium. FCR is the fastest reserve available in Europe (30 seconds or so).
aFRR: Automatic frequency restoration reserve. aFRR is the secondary reserve, and replaces the FCR (5 minutes).
mFRR: Manual Frequency Restoration Reserve. Tertiary reserves, kicking in from 12.5m minutes after initial shock. There are reserves after this like RR (replacement reserve) but this is more rare.
Day-Ahead Price: Day ahead prices show the energy price is evolving in the spot market.
It’s showing how the cost of reserves increases as energy floods the system, while the day-ahead price is diminishing given the strong solar production mix.
System-level solar will require another layer of thought
The rapid expansion of solar energy presents both opportunities and challenges.
One potential benefit is the prospect of increasingly affordable and potentially "free" energy as solar technology improves and economies of scale drive down costs.
However, the variable nature of solar power—dependent on geography, weather, and seasons—poses significant challenges for grid management. Countries with abundant sunlight may find themselves better positioned to harness solar energy efficiently, while those with less sunlight need to consider alternative strategies, such as investing in storage solutions or diversifying their renewable energy portfolio.
Take the sunny UK (we are writing this newsletter from an especially wet day in London). The UK gets 60% of the solar radiation comparable to the Equator. In its southern areas, it receives a similar amount of sunlight to Germany.
In the UK example, wind energy may be more appropriate and serves as a counterweight to daylight peaks from solar (wind typically peaks at night in most months of the year).
What a solar future could look like
The renewables revolution is underway, and solar while solar is one (large!) piece of this, it isn’t the entire story. As we navigate this transition, a nuanced understanding of solar dynamics and proactive grid management will be key to unlocking the full potential of solar power.
Week in Impact Articles ✍🏽
Monday: There are now 64,000 public charging points for electric cars in the UK
Tuesday: Mary Meeker's latest report on AI and Higher Education
Wednesday: AI Agents that Matter
Thursday: Clinical simulation an opportunity to evaluate digital health technologies
Friday: UK’s Octopus Energy plans to ramp up Texas presence with new investment
3 Key Charts 📊
1. It takes a village: how startups exist within the ecosystem
2. How we power ourselves
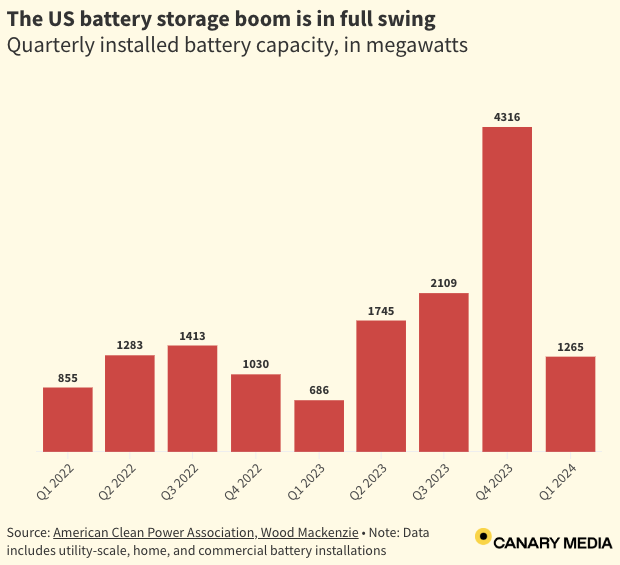
3. Another sort of boom: the rise and rise of batteries
Getting in Touch 👋.
If you’re looking for funding, you can get in touch here.
Don’t be shy, get in touch on LinkedIn or on our Website 🎉.
We are open to feedback: let us know what more you’d like to hear about 💪.


I like that your format is so compact :)