


How many companies are created each year?
Issue 131 l Eka’s Weekly Roundup (12 August 2025)

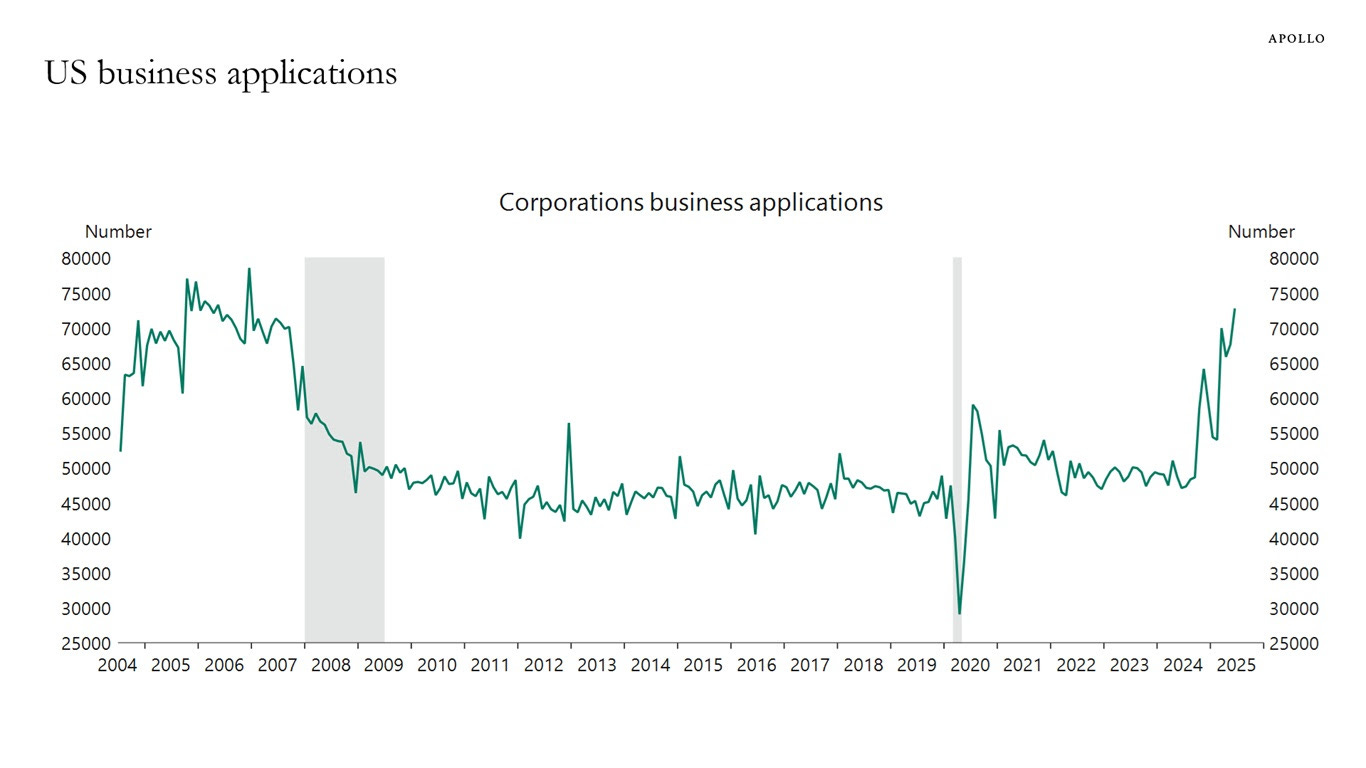
Torsten Slok published this chart yesterday in his daily column. His core argument: entrepreneurship and US dynamism is close to an all-time high. In July, the US recorded cover 70k new corporation business applications.
But what does this look like in the rest of the world? This week, we’re exploring the Dynamism point in the US and UK ecosystems using SEC and Companies House data, and looking at per capita company creation in key markets.
Diving into the company formation data 🗞️
Torsten Slok (an economist GOAT) published this chart yesterday in his Daily Spark column. His argument: entrepreneurship and US dynamism is close to an all-time high.
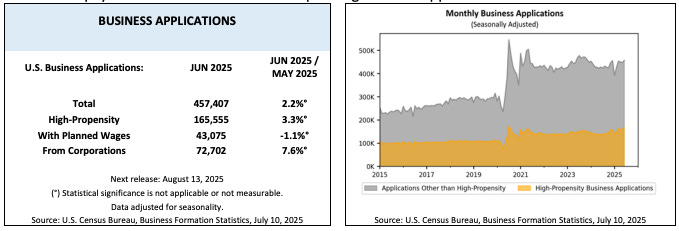
The chart is showing the number of applications for business applications in the United States. In the latest month, there were c.70k+ corporation business applications, a similar number to in 2005-06. There had already been a structural up-tick after Covid-19 relative to pre-2019. For example, entrepreneurs filed 5.2m “likely employer’ business applications between January ‘21 and December ‘23, roughly 1/3 above the rate filed between 2017-2019. The data comes form the US’s BFS bulletin, published by the US Department of Commerce.
The full data shows business applications across different categories (high-propensity, planned wages, corporations). Those outside the corporation bucket could be LLCs, partnerships, or sole proprietors.
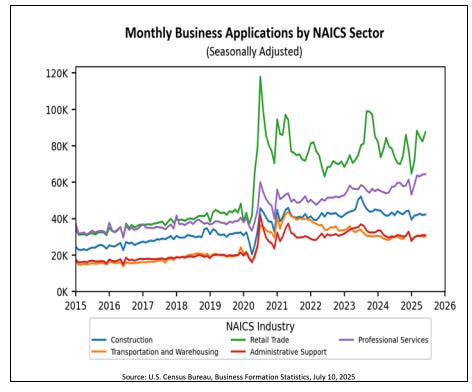
Interestingly, when looking at the sectors in which these businesses are being started (note this is total rather than just corporates), the 5 spotlighted NAICS sectors (NAICS = a tag for sectors) show a rise in professional services companies. The other NAICS sector we’d love to see on the chart is “Information”, which we assume will include many technology companies (though this is a lot smaller - 9k in the last month vs. c.100k in retail).
The US also has a high ‘failure rate’ of businesses. Only 35% of companies formed between March ‘13 and ‘23 were still operating by March ‘23 (interestingly Information and Mining are some of the worse retaining sectors to start companies in).
The UK also publishes no. of companies incorporated and closed in a quarterly bulletin. Note that the data also includes LLPs and PLCs (so it’s similar to the ‘Total’ number in the US).
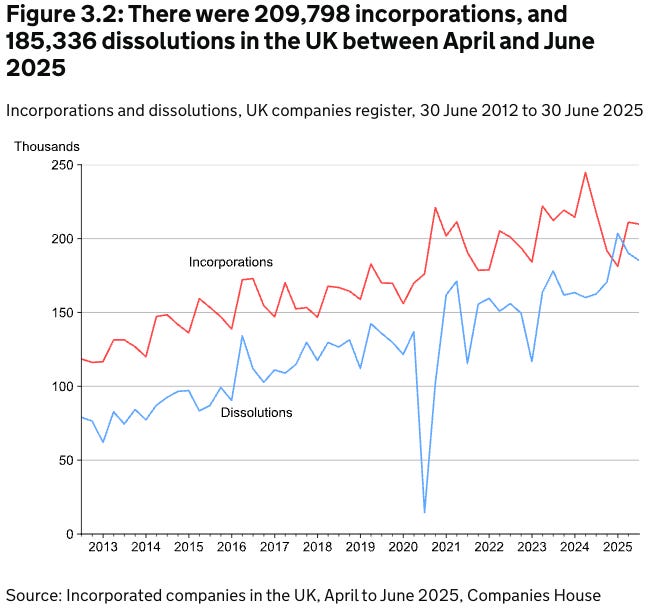
What’s pretty incredible is that the UK is starting c.70k companies per month (taking 210k for the quarter) compared to the US’s 457k, or 15% as many companies.
Over time, this has changed both on the UK and US side. There was a stark uptick during Covid-19 which looks to have shifted the trend line

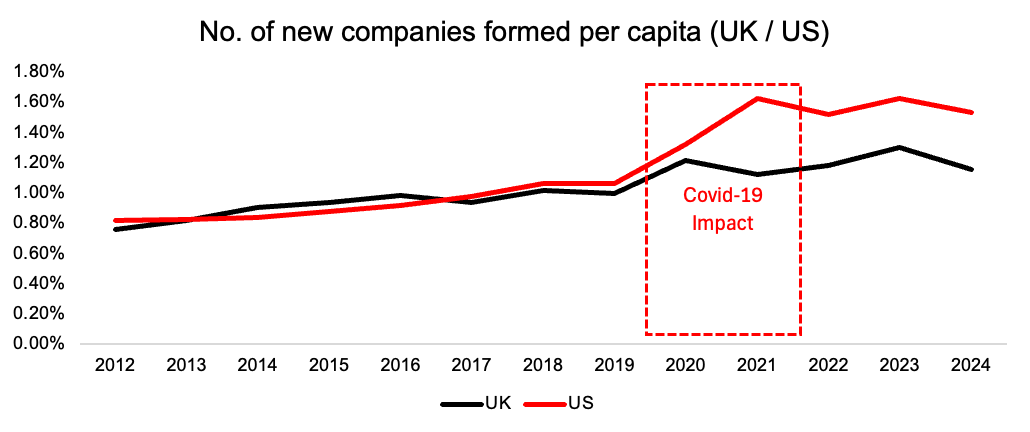
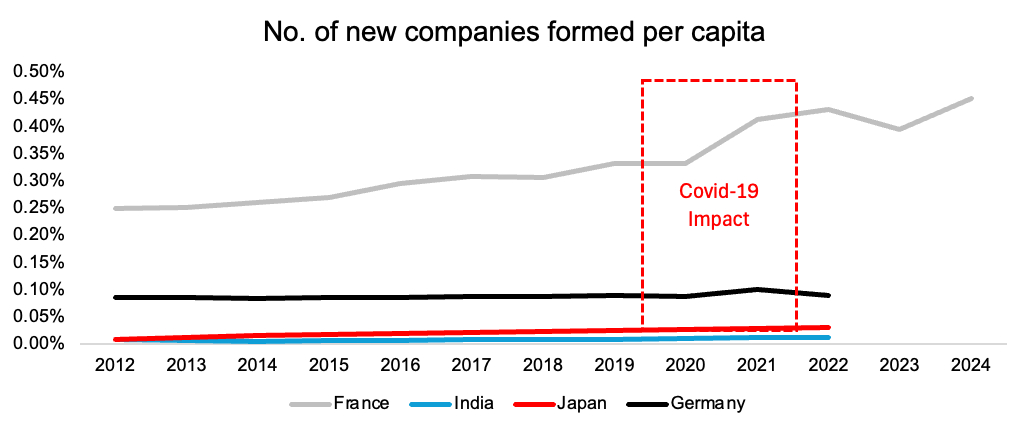
How does this compare with other countries? We then took a look at the Germany, France, Japan, and India using the World Bank and INEES (French equivalent of ONS) databases. The data isn’t totally up to date (i.e. World Bank has data until ‘22 rather than ‘24) but the conclusion is clear - the UK leads the pack outside the US.
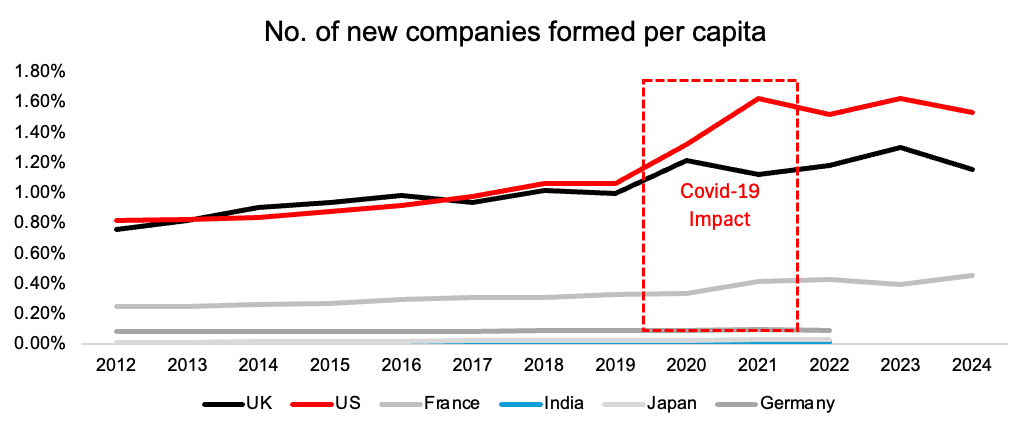
Looking below the UK and US, France is directionally becoming much stronger and looks to be accelerating on the Covid-19 trend.
For bonus reading, I was recommended Matt Clifford’s piece on the Disruption of Ambition and entrepreneurship being the new form of excellence in the 21st century. I’d highly recommend it, especially for some fun summer reading!
✍🏽 Week in Impact Articles
Monday: The Confluence of Energy Innovation and AI Demand in Data Centers
Tuesday: The Health of US Primary Care: 2025 Scorecard Report — The Cost of Neglect
Wednesday: The math behind preventive screenings (Neko & Co) – and what makes or breaks them
Thursday: Outlook on the EV transition
Friday: Will data centers crash the economy?
📊 3 Key Charts
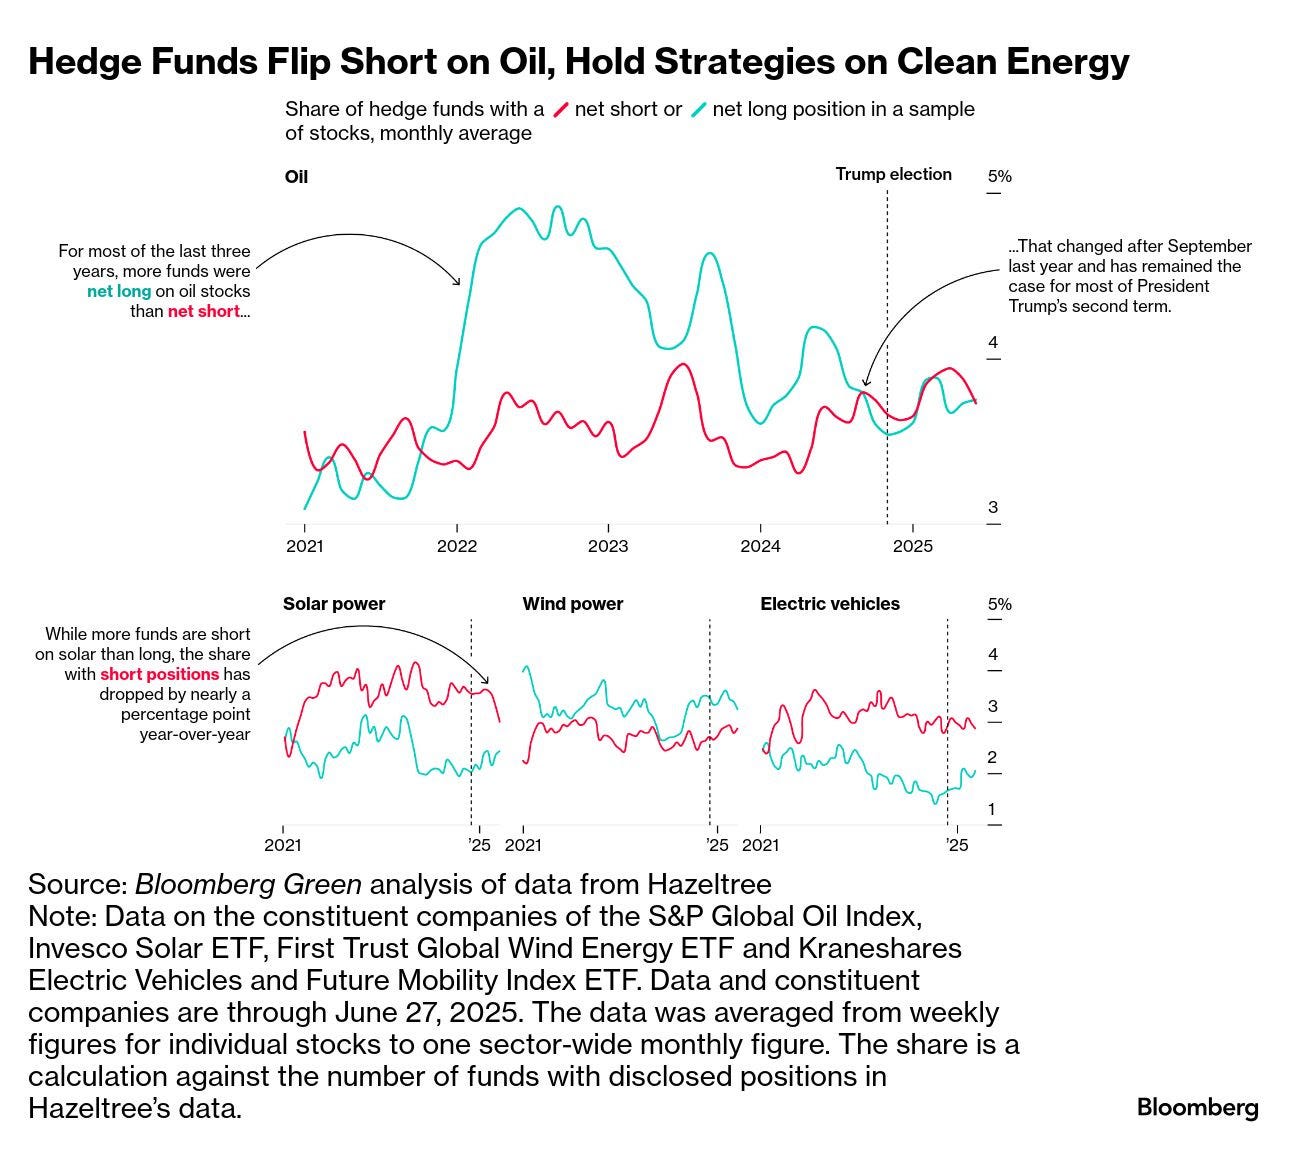
1. Hedge funds fall out of love with Oil & Gas strategies
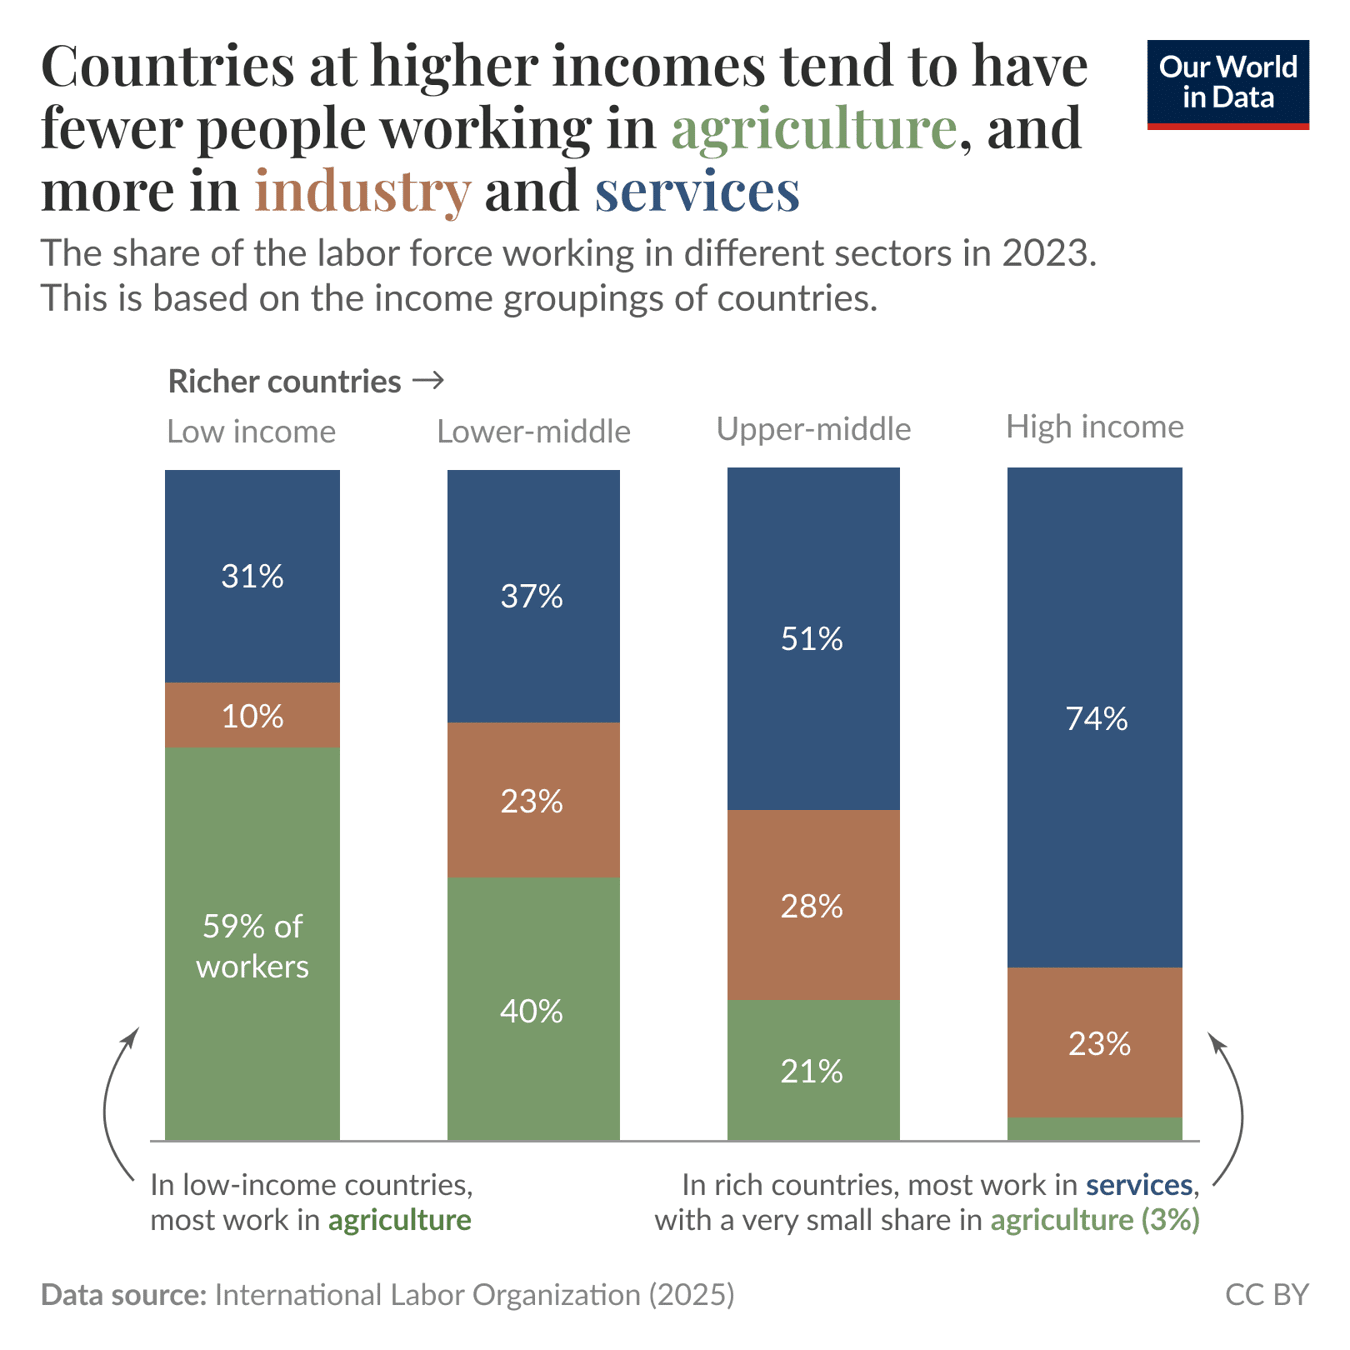
2. Who’s working where? A view on services versus industry depending on income.
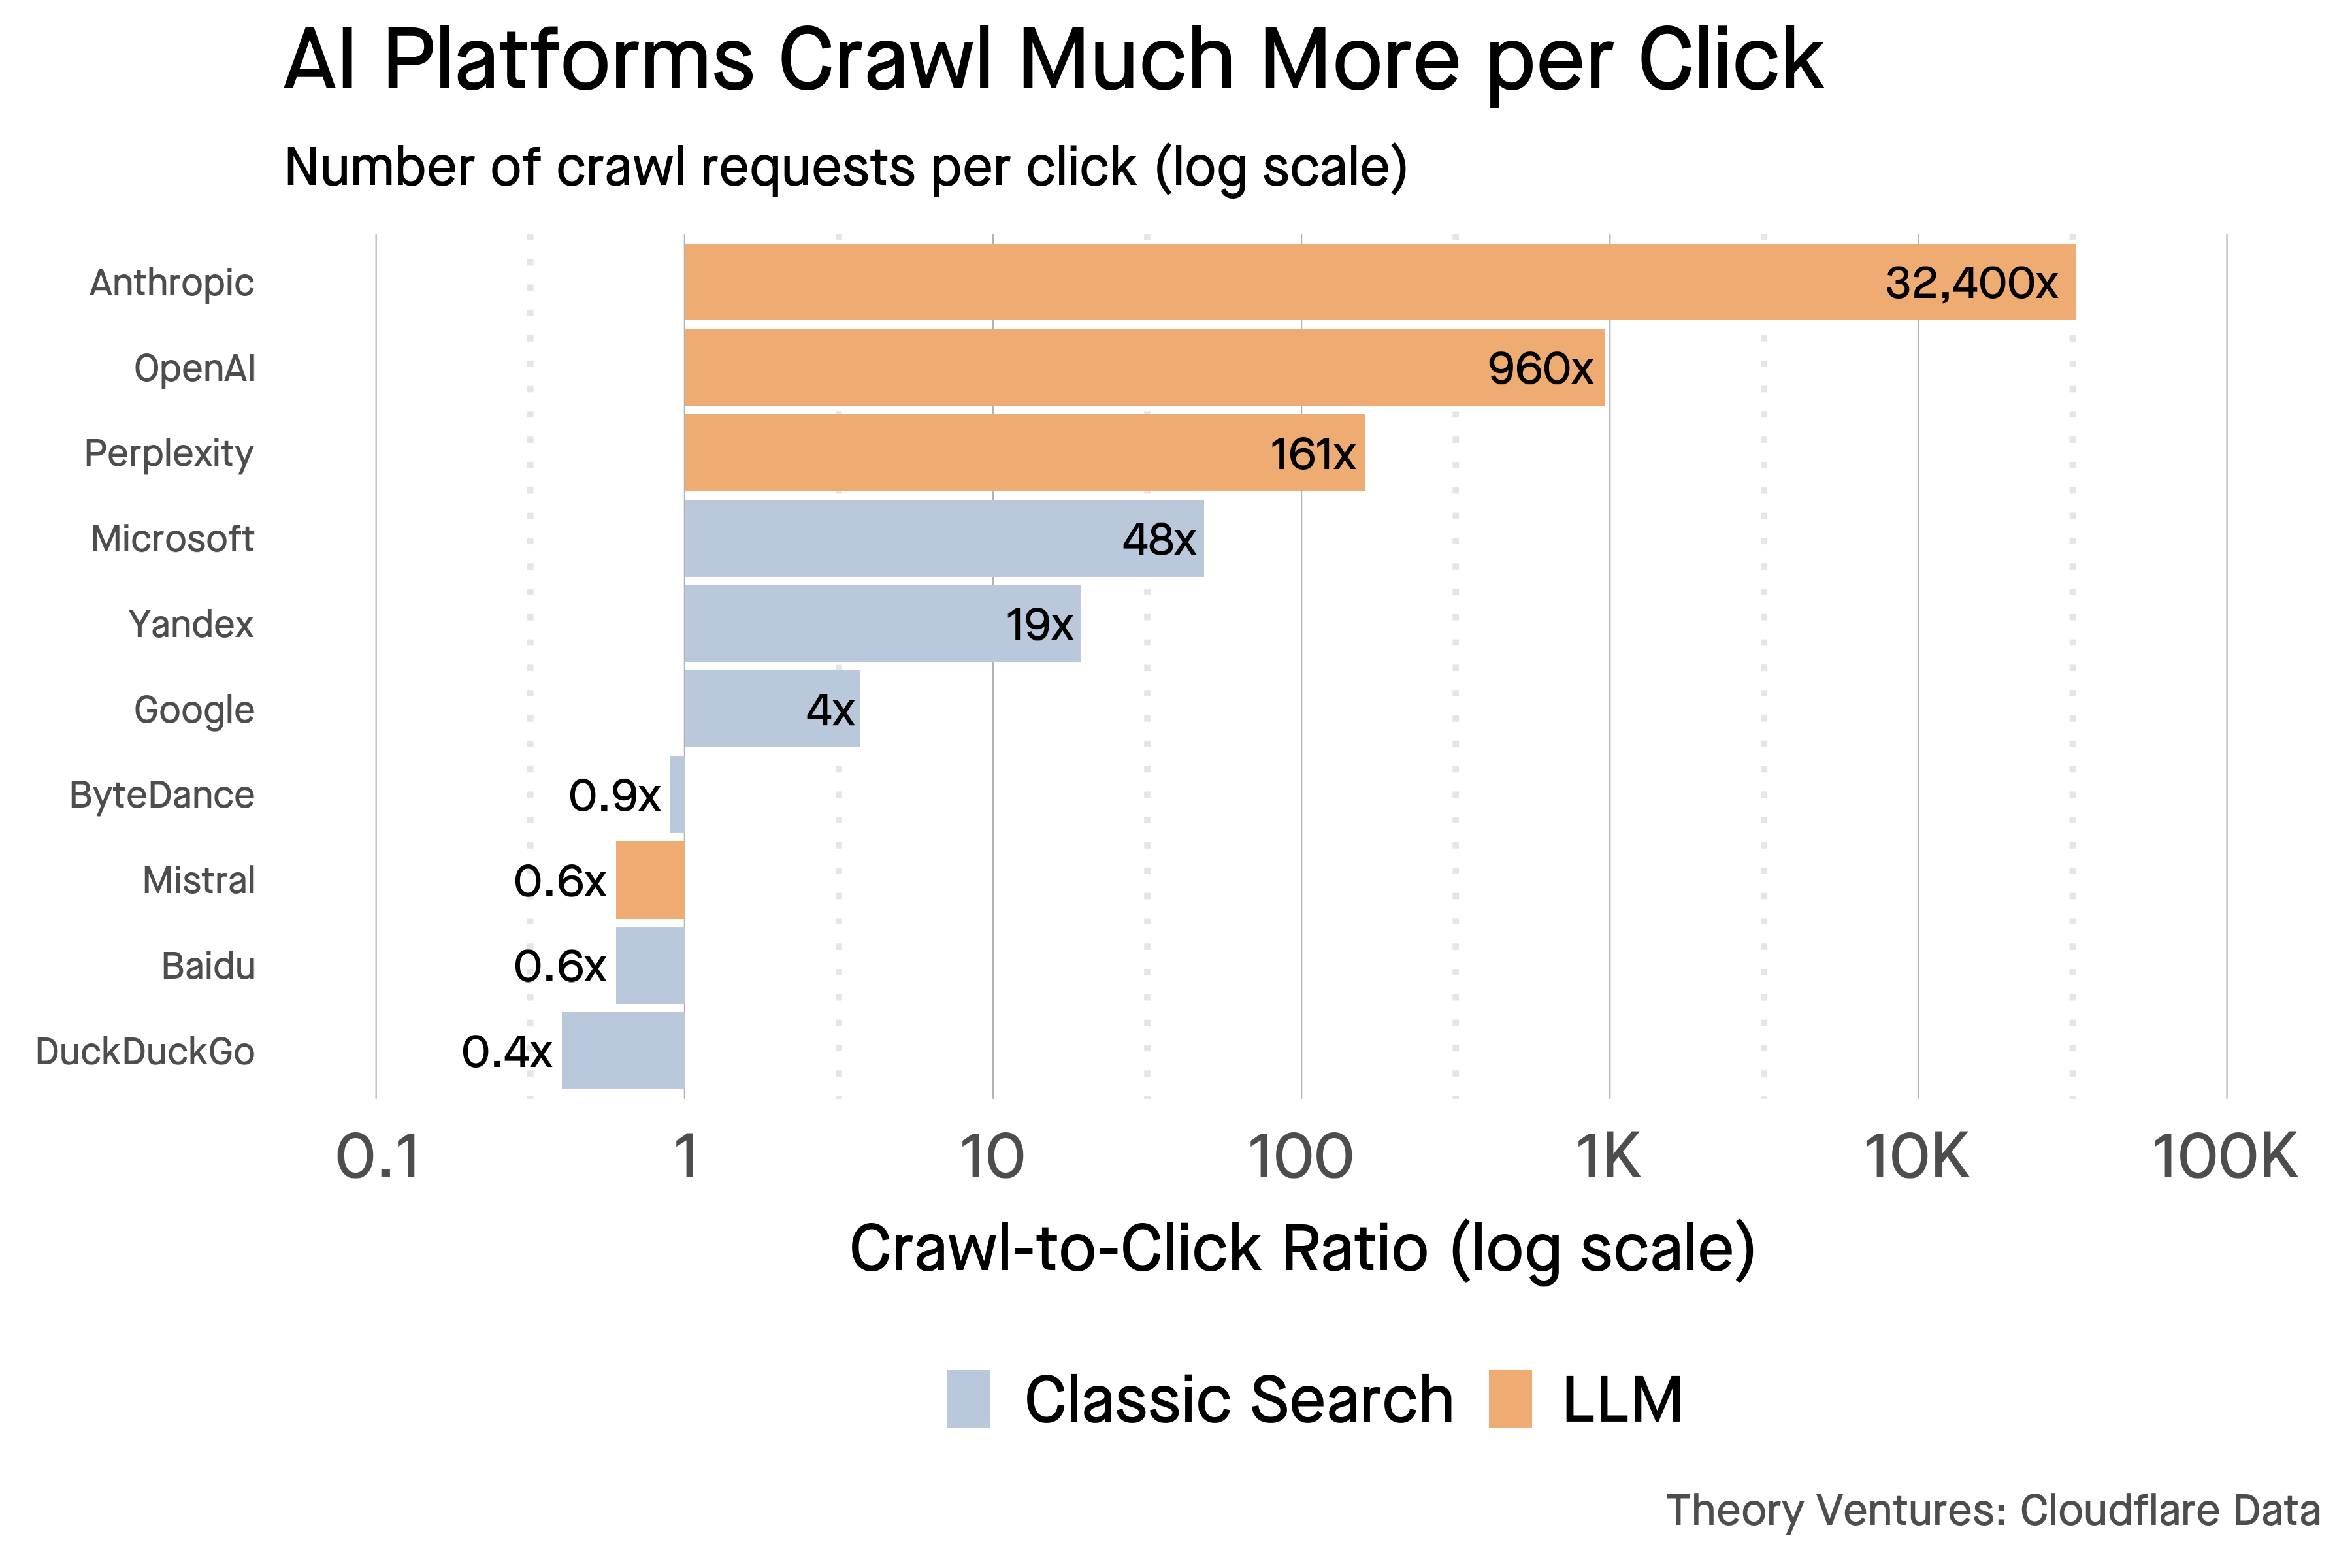
3. Fascinating chart on website visits: organic vs. trawlers
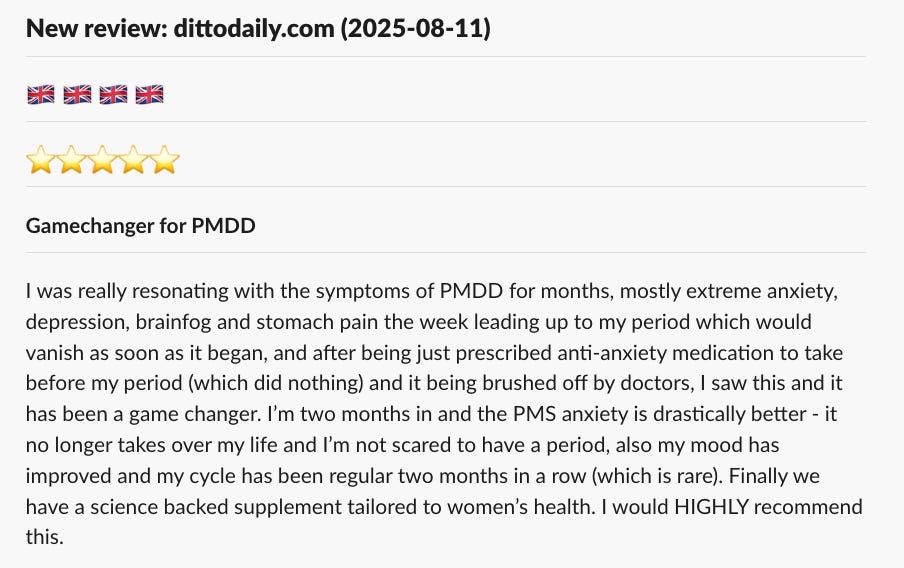
🗣️ Review of the Week
👋 Getting in Touch
If you’re looking for funding, you can get in touch here.
Don’t be shy, get in touch on LinkedIn or on our Website 🎉.
We are open to feedback: let us know what more you’d like to hear about 💪.