Eka’s Weekly Roundup (28 July 2023)
Issue 40 l Seven climate charts for July
We’re back after a short summer break in the heatwave-stricken Europe! This inspired us to take a look at different visualisations of climate change this year, ranging from the traditional heat graphs to more niche ocean and biodiversity infographics.
Seven climate charts for July 🗞️
1. Average global temperatures are going up… 🔥
The climate crisis is entering a new phase, with a scorching heatwave engulfing much of the northern hemisphere, numerous countries experiencing heavy rainfall, sea surface temperatures reaching unprecedented levels, and Antarctic sea ice reaching historic lows. Over the past weeks, a series of climate records, both official and unofficial, have been broken (The Guardian).
2. … with the relative year-on-year change accelerating in recent years 🌡️
The NASA data above depicts the variation in global surface temperature in relation to the long-term average between 1951 and 1980 (essentially another way at looking at the first graph). According to NASA/GISS, the year 2020 was statistically on par with 2016 as the hottest year recorded since data collection commenced in 1880. NASA's findings align closely with independent analyses conducted by the National Oceanic and Atmospheric Administration (NOAA) and other reputable institutions.
3. It’s not just land temperatures… oceans are warming up too 🌊
Global ocean surface temperature reached a record high for the third consecutive month (Climate Gov). The previously identified Weak El Niño conditions, which first appeared in May, further intensified in June, leading to above-average sea surface temperatures in the equatorial Pacific Ocean. Notably, June 2023 established a new record for the highest monthly sea surface temperature anomaly in NOAA's 174-year data record. It's important to highlight that the Southern Hemisphere experienced its hottest June on record, while the Northern Hemisphere matched the warmth observed in June 2019.
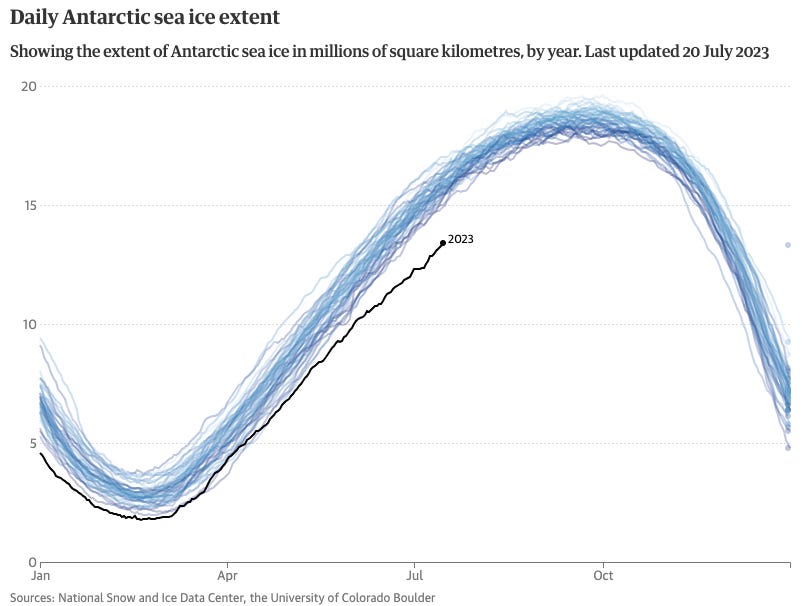
4. Leading to the decline of Antarctic sea ice 🧊
Despite experiencing above-average heat in the air and sea surface, Antarctica is witnessing new records being set for its sea ice, which unfortunately means there is very little of it. This decline in sea ice extent is part of an ongoing trend, with several new records established over the past few years.
According to satellite data from the National Snow and Ice Data Center, 2023 stands out as a notable outlier, and even in 2022, the year ended with some of the lowest sea ice extents ever recorded. The gap between the current sea ice extent and the long-term average for this time of year seems to be widening, indicating a concerning trend.
5. Let’s remember the impact this has on biodiversity 🐻❄️
As the FT wrote, the decline in biodiversity since 1970 appears remarkably consistent and smooth. Biodiversity is gaining prominence on the business risk agenda, coinciding with recent research indicating a more severe rate of global animal species extinction than previously estimated.
Based on the latest research conducted by scientists from Queen’s University Belfast, it was determined that more than 71,000 species are experiencing a decline, amounting to 48% of the total. 33% of the species considered "non-threatened" by the International Union for Conservation of Nature were also found to be declining. Only 3% of species were showing signs of growth.
6. The UK is seeing temperature anomalies virtually everywhere in June… 🥵
The UK experienced its warmest June in history, dating back to 1884, with all its constituent countries, England, Scotland, Wales, and Northern Ireland, recording record-breaking temperatures (Met Office). The mean temperature for June 2023 was 15.8°C, surpassing the average by 2.5°C. High pressure at the start of the month gave way to warm and humid air, resulting in temperatures reaching as high as 32.2°C. Notably, eight out of twelve months have seen temperature records set since 2006 in the historical series.
7. … and despite popular belief, June saw more sunshine than usual ☀️
During June, the UK had the sunniest month since 1957 and the fourth sunniest on record (Met Office). Scotland, England, Northern Ireland, and Wales also saw remarkable sunshine, with Scotland having its third sunniest June (231.4 hours), England its fourth sunniest (259.8 hours), Northern Ireland its eighth sunniest (228.7 hours), and Wales its ninth sunniest (242.8 hours). Let’s see what the July data looks like when that comes out…
Week in Impact Articles ✍🏽
Monday: How labels impact the way we eat
Tuesday: Oura rings and founder burnout
Wednesday: UK pension reform and allocations to private equity
Thursday: Nasa - a year in climate
Friday: Vegans, vegetarians, fish-eaters and meat-eaters in the UK show discrepant environmental impacts
3 Key Charts 📊
1. Consumer attitudes towards reducing carbon footprints rely on vehicles
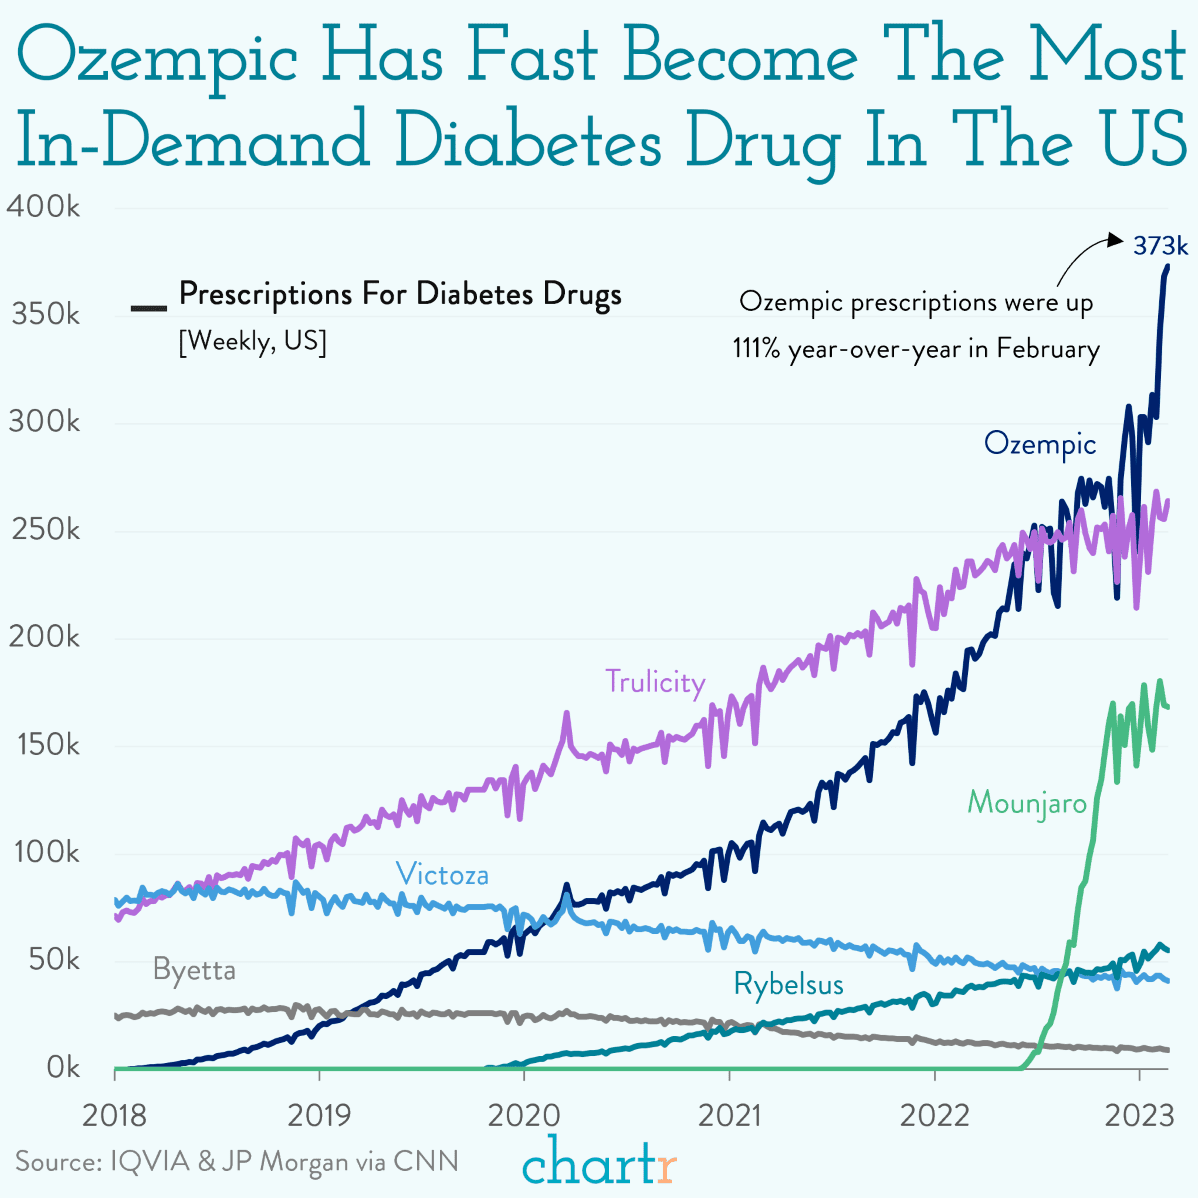
2. Ozempic’s incredible rise over a 5 year period has overtaken Trulicity
3. Positive attitudes towards ESG proposals came down last year
Deal Capture 💰
Deals in the impact space across the UK and Europe
Bloom Money
UK-based fintech raised £1m. Led by Zinal Growth alongside January Ventures and Pact VC.
Carbon13
Climate accelerator Carbon13 raised £2m. Included True Ventures.
Materials Nexus
Raw materials company Materials Nexus raised £2m. Included Ada Ventures and Cell Capital.
Milliways
Foodtech company Milliways raised £3m. Included KLT.
SpaceDots
Satellite hardware developer SpaceDots raised £1m. Included Blue Wire Capital and 7Percent.
Getting in Touch 👋.
If you’re looking for funding, you can get in touch here.
Don’t be shy, get in touch on LinkedIn or on our Website 🎉.
We are open to feedback: let us know what more you’d like to hear about 💪.


